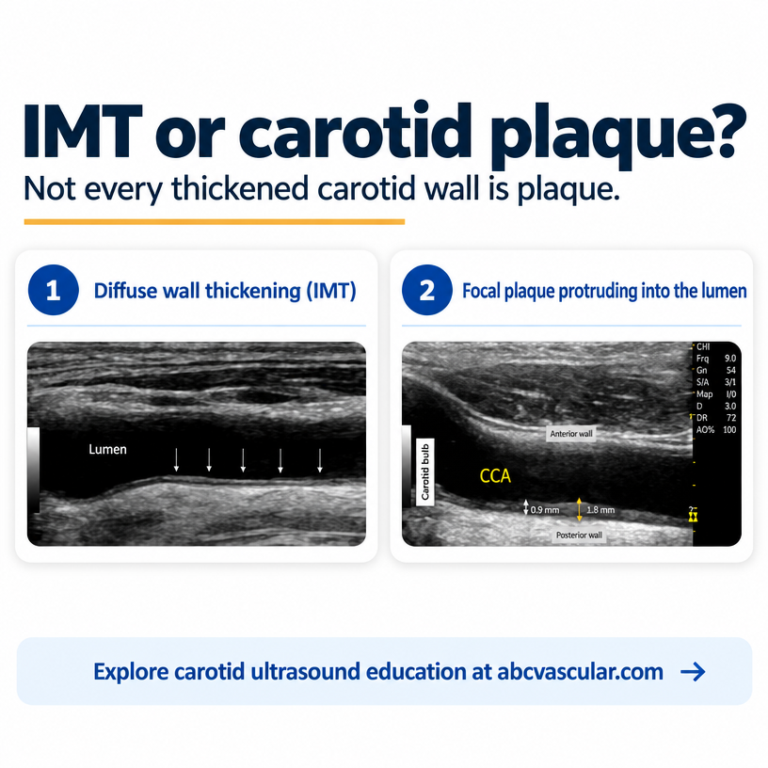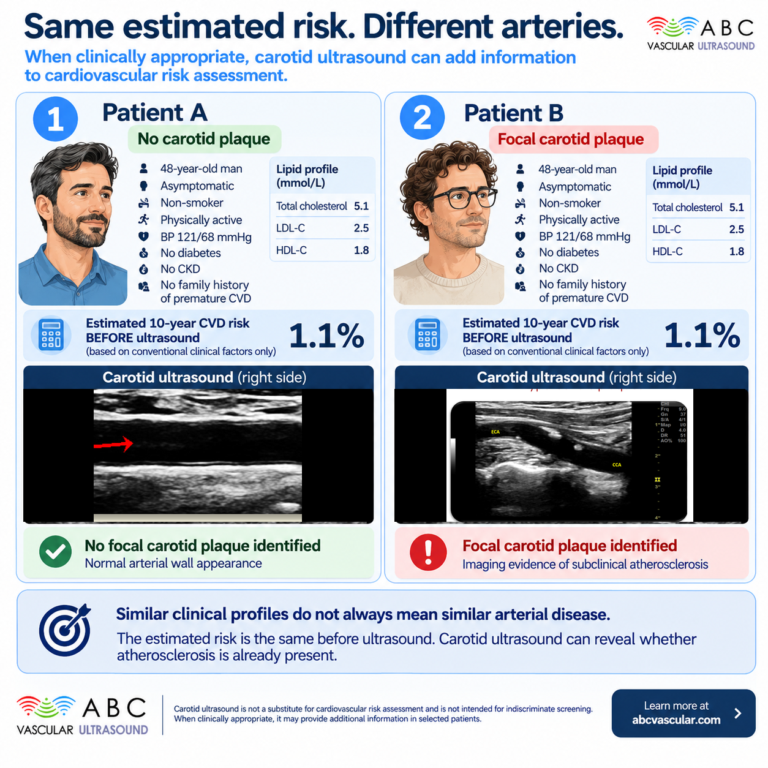

A side-by-side comparison of two assessment paradigms: degree-of-stenosis reporting alone versus stenosis plus plaque characterisation. Covers what each measures, how each maps to surveillance intervals, medical therapy and referral decisions, the practical scanning differences, reproducibility limits, and a decision framework for applying plaque features at the bedside.
 and
For as long as carotid ultrasound has been reported, one number has dominated the page: the percentage stenosis. It is the figure handed to the vascular multidisciplinary meeting, the figure that anchors the major trials, and the figure most clinicians ask for when a scan is requested. There is good reason for that. A percentage is reproducible, it is teachable, and it maps onto the evidence that shaped modern carotid practice.
But a percentage describes geometry, not biology. Two patients can both carry a 60% internal carotid artery stenosis and face very different risks over the coming year, because one plaque is a dense, smooth, fibrotic ridge while the other is an echolucent, irregular lesion made of the tissue that tends to embolise. The number is identical. The arteries are not. Plaque characterisation is the part of the assessment that closes that gap, and it is the part that most often changes what you do next.
This article puts the two approaches side by side. It compares what degree-of-stenosis reporting can and cannot tell you, what plaque characterisation adds, and where the difference between them turns into a real management decision.
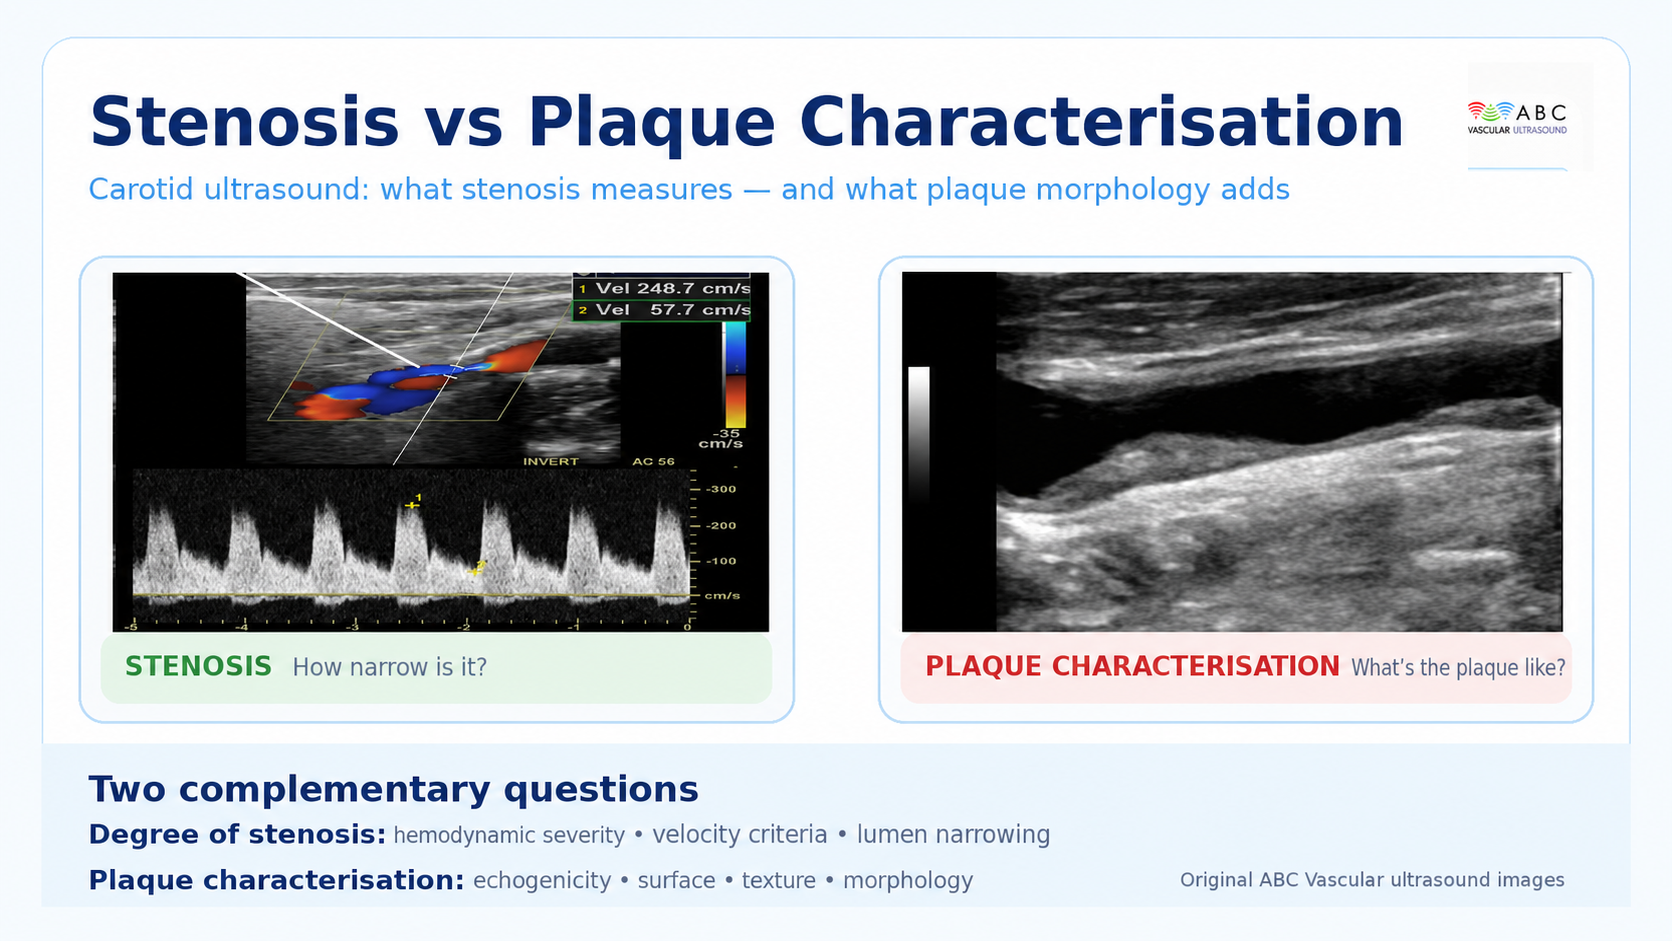
Degree-of-stenosis reporting is essentially haemodynamic. You interrogate the stenosis with Doppler, record peak systolic and end-diastolic velocities, and apply validated criteria to translate those velocities into a percentage. The percentage refers back to the angiographic thresholds used in the landmark trials, which is why the same 50% or 70% boundary travels from trial data into your report.
This approach has real strengths. Velocity criteria are widely reproducible, they are backed by decades of outcome data, and they let a laboratory communicate in a shared language. When a surgeon reads ‘70% ICA stenosis’, they know what has been implied and what evidence sits behind it.
The limitations are equally real. Velocities are a surrogate for narrowing, and surrogates fail in predictable places. Near-occlusion can produce deceptively low velocities because flow is critically reduced rather than accelerated. Heavily calcified plaques cast acoustic shadowing that makes the residual lumen hard to judge and can distort velocity sampling. Tandem lesions and contralateral disease alter the haemodynamics on the side you are measuring. And in the patient with a borderline stenosis, the percentage often cannot separate the plaque that is dangerous from the plaque that is merely present.
Most importantly, the percentage carries no information about composition. It tells you how much of the lumen is narrowed, not what the narrowing is made of.
Plaque characterisation looks at the lesion itself rather than at its haemodynamic consequence. In a practical carotid protocol it usually draws on several observable features.
Echogenicity and the grey-scale median (GSM): how bright or dark the plaque appears relative to the surrounding blood and vessel wall. Echolucent, soft-looking plaque is consistently the type linked with higher embolic risk, while bright, densely fibrotic or calcified plaque tends to behave more indifferently.
Surface configuration: whether the plaque surface is smooth, irregular, or frankly ulcerated. An ulcerated surface gives thrombus somewhere to form and a route to embolise.
Texture and heterogeneity: whether the plaque is homogeneous or a mixture of tissue types. Heterogeneous plaque more often contains the lipid-rich and haemorrhagic components associated with instability.
Plaque area and volume: the two-dimensional plaque area and the extent of the lesion, which capture burden in a way a percentage cannot.
Additional techniques: the juxtaluminal black (echolucent) area, and contrast-enhanced ultrasound to visualise intraplaque neovascularisation, a marker of the inflammatory activity that precedes rupture.
None of these features is a single decisive test. Together, though, they describe the biology of the plaque, and biology is what determines whether a patient becomes symptomatic in the next twelve months.
It helps to compare the paradigms on the dimensions that matter in the reading room.
What is measured. Stenosis reporting measures the lumen. Plaque characterisation measures the wall.
The question answered. Stenosis reporting answers ‘how narrow is it?’. Plaque characterisation answers ‘how dangerous is it?’.
Reproducibility. Stenosis reporting has the advantage of long-standing standardisation, though it degrades in near-occlusion and with heavy calcification. Plaque characterisation is more operator- and machine-dependent, which is precisely why standardised settings and consistent scoring matter.
Effect on management. This is where the comparison becomes clinically interesting. The degree of stenosis already changes management at its established thresholds, particularly in symptomatic disease. Plaque characterisation changes management mostly in the grey zones: the borderline stenosis, the asymptomatic high-grade lesion, and the plaque that is the likely source in a patient whose symptoms do not fit the percentage.
Equipment and skill demand. Both need a good machine and a competent operator. Plaque characterisation rewards attention to B-mode optimisation, because the appearance of the plaque depends heavily on gain, frequency, and the preset you are using.
A stenosis-only pathway tends to set follow-up by percentage bands. Add characterisation and the interval can be reasoned rather than inherited. A smooth, echogenic, homogeneous 50% plaque in an asymptomatic patient with well-controlled risk factors supports a relaxed surveillance interval. An echolucent, irregular plaque of the same size argues for closer follow-up, because what has changed is not the number but the risk it represents.
Plaque features can tip the decision to intensify best medical therapy. When a scan shows an unstable-looking plaque, the case for tightening blood pressure control, optimising lipid therapy, and reviewing antiplatelet strategy becomes more concrete, and the conversation with the patient becomes easier because you can explain what you are treating.
In symptomatic disease the degree of stenosis remains the primary driver of the referral decision. Plaque characterisation sharpens the decision at the margins: it supports intervention in the symptomatic patient with a borderline stenosis but a clearly unstable plaque, and it prompts caution where a high velocity reading is generated by a heavily calcified lesion whose true residual lumen is uncertain. In asymptomatic disease, where the balance between procedural risk and stroke prevention is finely set, characterisation is often the feature that separates patients who can be safely watched from those who warrant referral.
The same principle travels to other territories. Plaque characterisation in the femoral and other peripheral beds, and the total plaque burden visible on a scan, feed into cardiovascular risk assessment in a way a single percentage never will.
The practical differences between the two paradigms are smaller than the conceptual ones, but they matter.
Stenosis reporting leans on Doppler. You find the stenosis, you sample it carefully with angle correction, and you record velocities. Plaque characterisation leans on a well-optimised B-mode image. That means paying attention to gain, time-gain compensation, focus, frequency, and depth so that the plaque’s echogenicity is represented faithfully rather than artificially brightened or darkened by the machine.
For serial comparison, consistency is everything. If you intend to track a plaque’s GSM or echogenicity over time, the same machine, preset, and settings should be used at each visit, because changing any of them changes the measurement. Saving a short, standardised clip alongside the still images costs seconds and makes the next scan far more interpretable.
The interesting cases are the discordant ones, and they are common. A high peak systolic velocity in a vessel with a heavily calcified plaque raises the question of whether the velocity reflects true narrowing or an acoustic artefact of the calcification. A low velocity in a vessel with a bulky soft plaque raises the opposite concern, that near-occlusion is being under-called. A patient with modest stenosis but a large, sonographically active plaque may carry more embolic risk than the percentage implies, while a patient with high-grade stenosis but a dense, smooth, calcified plaque may be at lower short-term risk than the number suggests.
None of these conflicts is resolved by choosing one paradigm and discarding the other. They are resolved by reporting both, and by being explicit about the discordance in the report so the referring clinician understands what is certain and what is uncertain.
A simple, repeatable sequence keeps both paradigms in play.
Measure and report the degree of stenosis using your laboratory’s validated criteria, and state the method used.
Score plaque echogenicity, ideally with GSM where your equipment supports it, using consistent settings.
Describe the plaque surface, noting irregularity or ulceration.
Note texture, plaque area, and any features such as a juxtaluminal black area that you are confident about.
Integrate the characterisation with the clinical picture: symptoms, risk factors, and the contralateral vessels.
Match the combined picture to a pathway, whether that is surveillance, intensified medical therapy, or referral.
Document everything in a structured template so the next scan, on the next machine and possibly by the next sonographer, can be compared meaningfully.
Plaque characterisation is only as good as the discipline behind it. Interobserver variability is real, and a feature one reader calls echolucent another may call mixed. Machine settings drift between visits and quietly change the appearance of a plaque over time. Single features get over-read, so that an irregular surface alone becomes an unspoken indication for surgery when it should be one input among several. And comparing an echogenicity score across two different machines is a shortcut that produces confident, and confidently wrong, conclusions.
The antidote is standardisation, honest reporting of uncertainty, and the habit of treating the plaque, not the number, as the object of the examination.
Guideline thinking has moved in this direction for some years. Contemporary carotid recommendations acknowledge that plaque characteristics can act as risk modifiers alongside the degree of stenosis, and several large observational studies and pooled analyses have associated echolucent plaque and irregular or ulcerated surfaces with elevated stroke risk. The honest summary is that plaque characterisation does not replace the degree of stenosis, and no single ultrasound feature carries the weight of a randomised indication. What it does is refine risk in the patients for whom the percentage is least informative.
That refinement is worth having. A more accurate risk picture changes surveillance intervals, sharpens the threshold for referral, and gives you a better basis for the conversation you have with the patient in front of you.
Reading plaque characterisation from a scan is a practical skill, and it grows with repetition, feedback, and exposure to varied cases. Recognising the difference between an echolucent plaque and a shadowed one, or between genuine surface irregularity and an artefact, takes guided practice with real images and a systematic approach.
ABC Vascular supports that practice directly. The accredited online courses in vascular ultrasound walk through image acquisition, plaque assessment, and reporting using real case studies and interactive quizzes, so you can build the technique at your own pace and earn CME/AMA credits as you go. If you want a focused reference for the ultrasound assessment of carotid atherosclerotic plaques, the Vascular Ultrasound Book 2025, written as a practical guide with an image gallery, pairs with the courses and gives you the criteria to apply in your own laboratory.
Master vascular ultrasound, anywhere, anytime.